
How Our AI-Powered System Automates Class Location Monitoring for Oil & Gas Pipeline Operators
Development
Reading time
6
mins


Running oil and gas pipelines across thousands of miles of shifting terrain carries immense responsibility.
Beyond ensuring the safe and efficient transport of vital energy resources, managing vast pipeline networks involves navigating strict safety standards and evolving regulatory requirements.
In simple terms, operators must constantly adapt to the physical environment that surrounds the pipeline, such as when a quiet rural area gradually turns into a housing subdivision or a commercial development, which is why monitoring technology plays such an important role in keeping track of those changes across thousands of miles of pipeline.
The global pipeline monitoring system market size is projected to grow from USD 18.8 billion in 2026 to USD 38.4 billion by 2033, at a CAGR of 10.3%.
In this article, we’ll look at how technology supports class location monitoring today, where the process still leaves room for improvement, and how the AI-powered solution we developed at Profico can give operators more context around each detected change.
The context: What is Class Location?
While numerous engineering factors influence pipeline design, class location is the fundamental concept that dictates the safety standards and maximum operating pressures applicable to different pipeline sections.
Class location is a regulatory classification based on population density that directly determines the safety standards and maximum operating pressure for a specific segment of pipeline.
In areas with higher population density, the risk of an incident affecting human life is greater, necessitating stricter safety protocols, thicker steel pipes, or lower operating pressures.
To standardize this, regulators categorize pipeline segments into four distinct classes based on the number of buildings intended for human occupancy within 220 yards (or around 202 meters) of the pipeline over a continuous one-mile span:
Class 1: Rural, sparsely populated areas with ten or fewer buildings within the specified distance. The risk to human life here is considered minimal.
Class 2: Transitional or suburban areas containing between 11 and 45 buildings.
Class 3: Densely populated suburban or urban areas with 46 or more buildings. The risk profile here is significantly higher.
Class 4: Highly urbanized city centers or business districts characterized by buildings with four or more stories.
The Challenge: How can we enhance the pipeline monitoring process with AI?
As we learned how operators monitor their pipeline networks and how existing technology supports that process, we found that these systems are already good at detecting and assessing changes along the pipeline.
For example, operators can use satellite or aerial imagery to monitor the surface around their pipelines, with new images collected as part of scheduled patrols or through satellite services that can revisit the same area much more frequently.
To find what changed, the system compares images of the same location taken at different times.
Machine learning can then analyze those changes and estimate whether what appeared matches the patterns associated with the risks it was trained to recognize.
But even with ML analyzing those differences and identifying changes such as new construction, structures, or ground disturbance along the pipeline, the best-performing model reached an F1 score of about 70%, meaning operators still have to deal with changes the model misses and detections that turn out not to be relevant (according to the Effective Risk Detection for Natural Gas Pipelines Using Low-Resolution Satellite Imagery study).
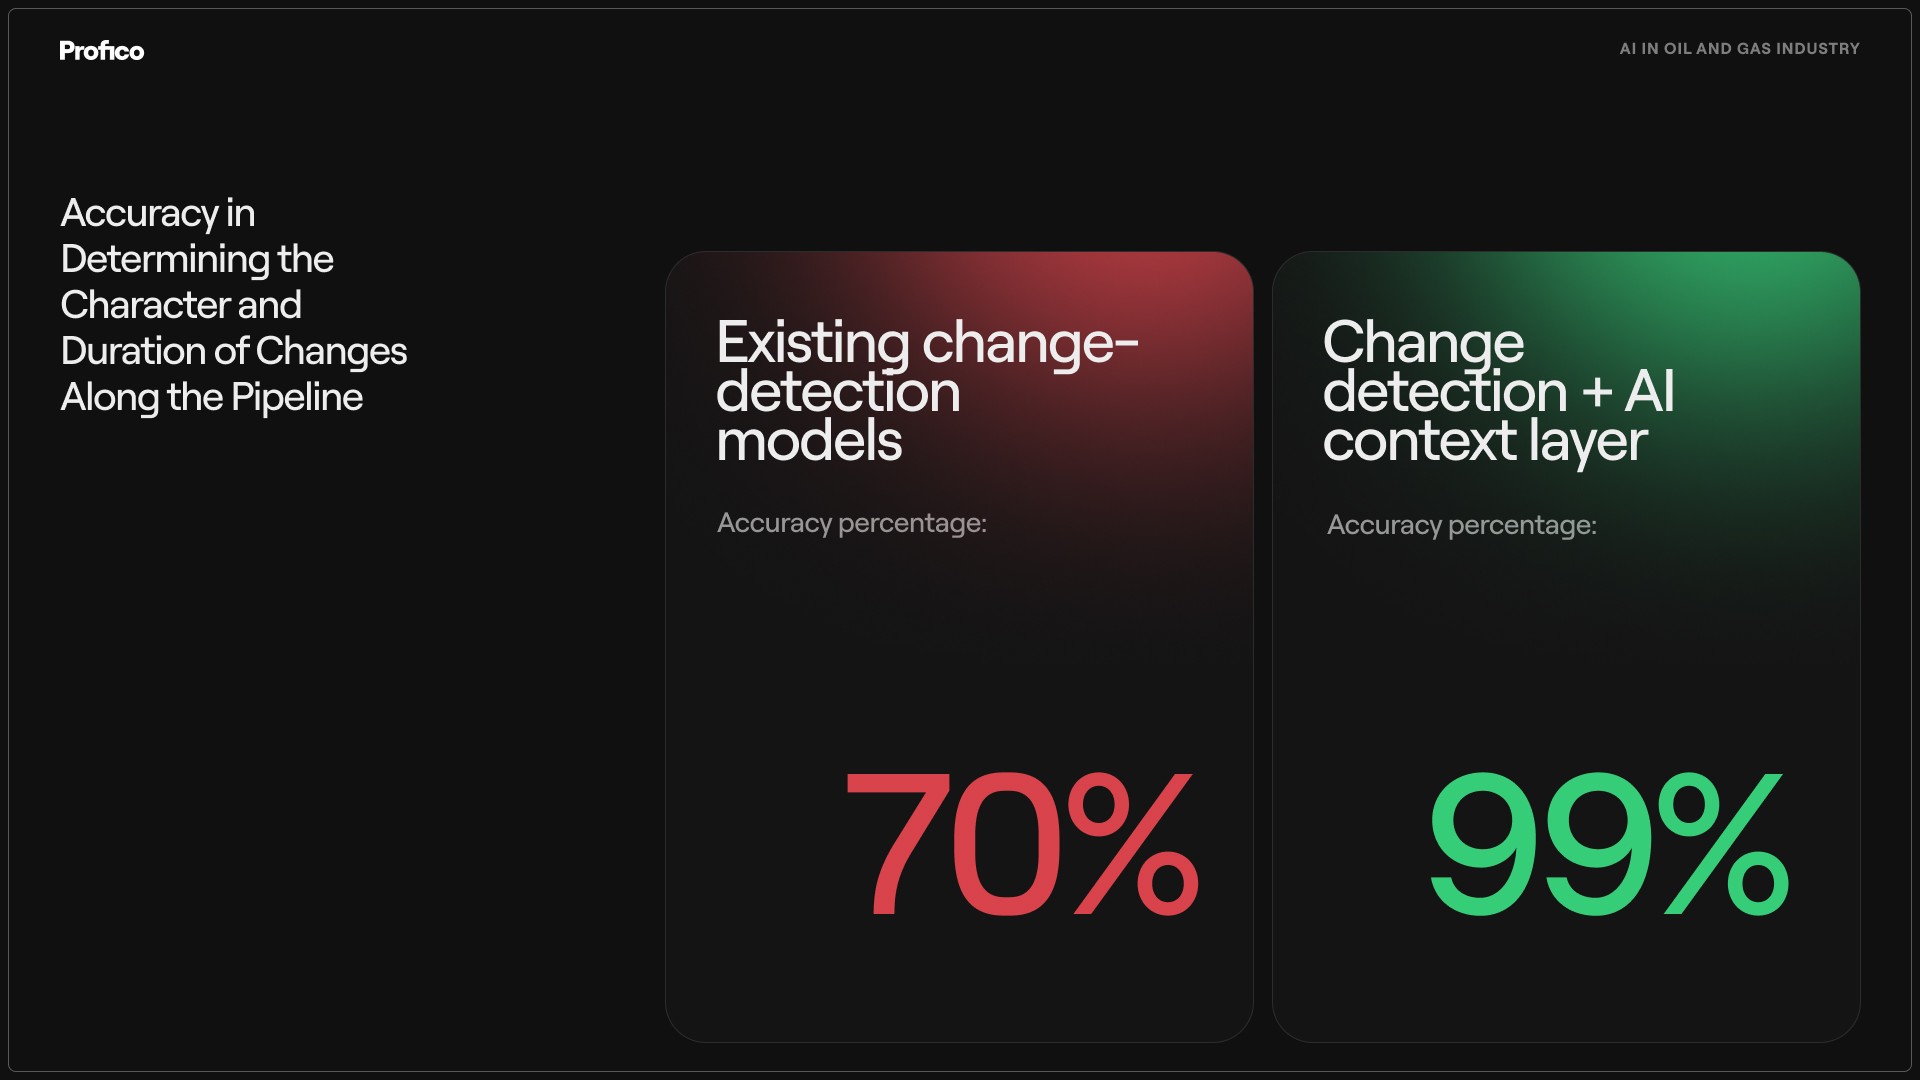
Since we realised that current models still won’t give operators information such as what a property is registered as or whether the activity they detected is temporary, we started looking at whether AI could connect what the model sees with information from other sources and give operators more context around each change.
Integrating an AI Layer over Standard Spatial Workflows
To give operators more information about each detected change, we added an agentic AI layer to the existing spatial workflow.
Its job is to connect a detected change with relevant external sources including:
land registry records
building permits
open mapping systems with crowdsourced data
and other public information that can help determine whether something is temporary.
By putting those pieces together, AI systems can establish the character of the change and how long it is likely to remain, with up to 99% certainty.
So how do we add context to each detected change?
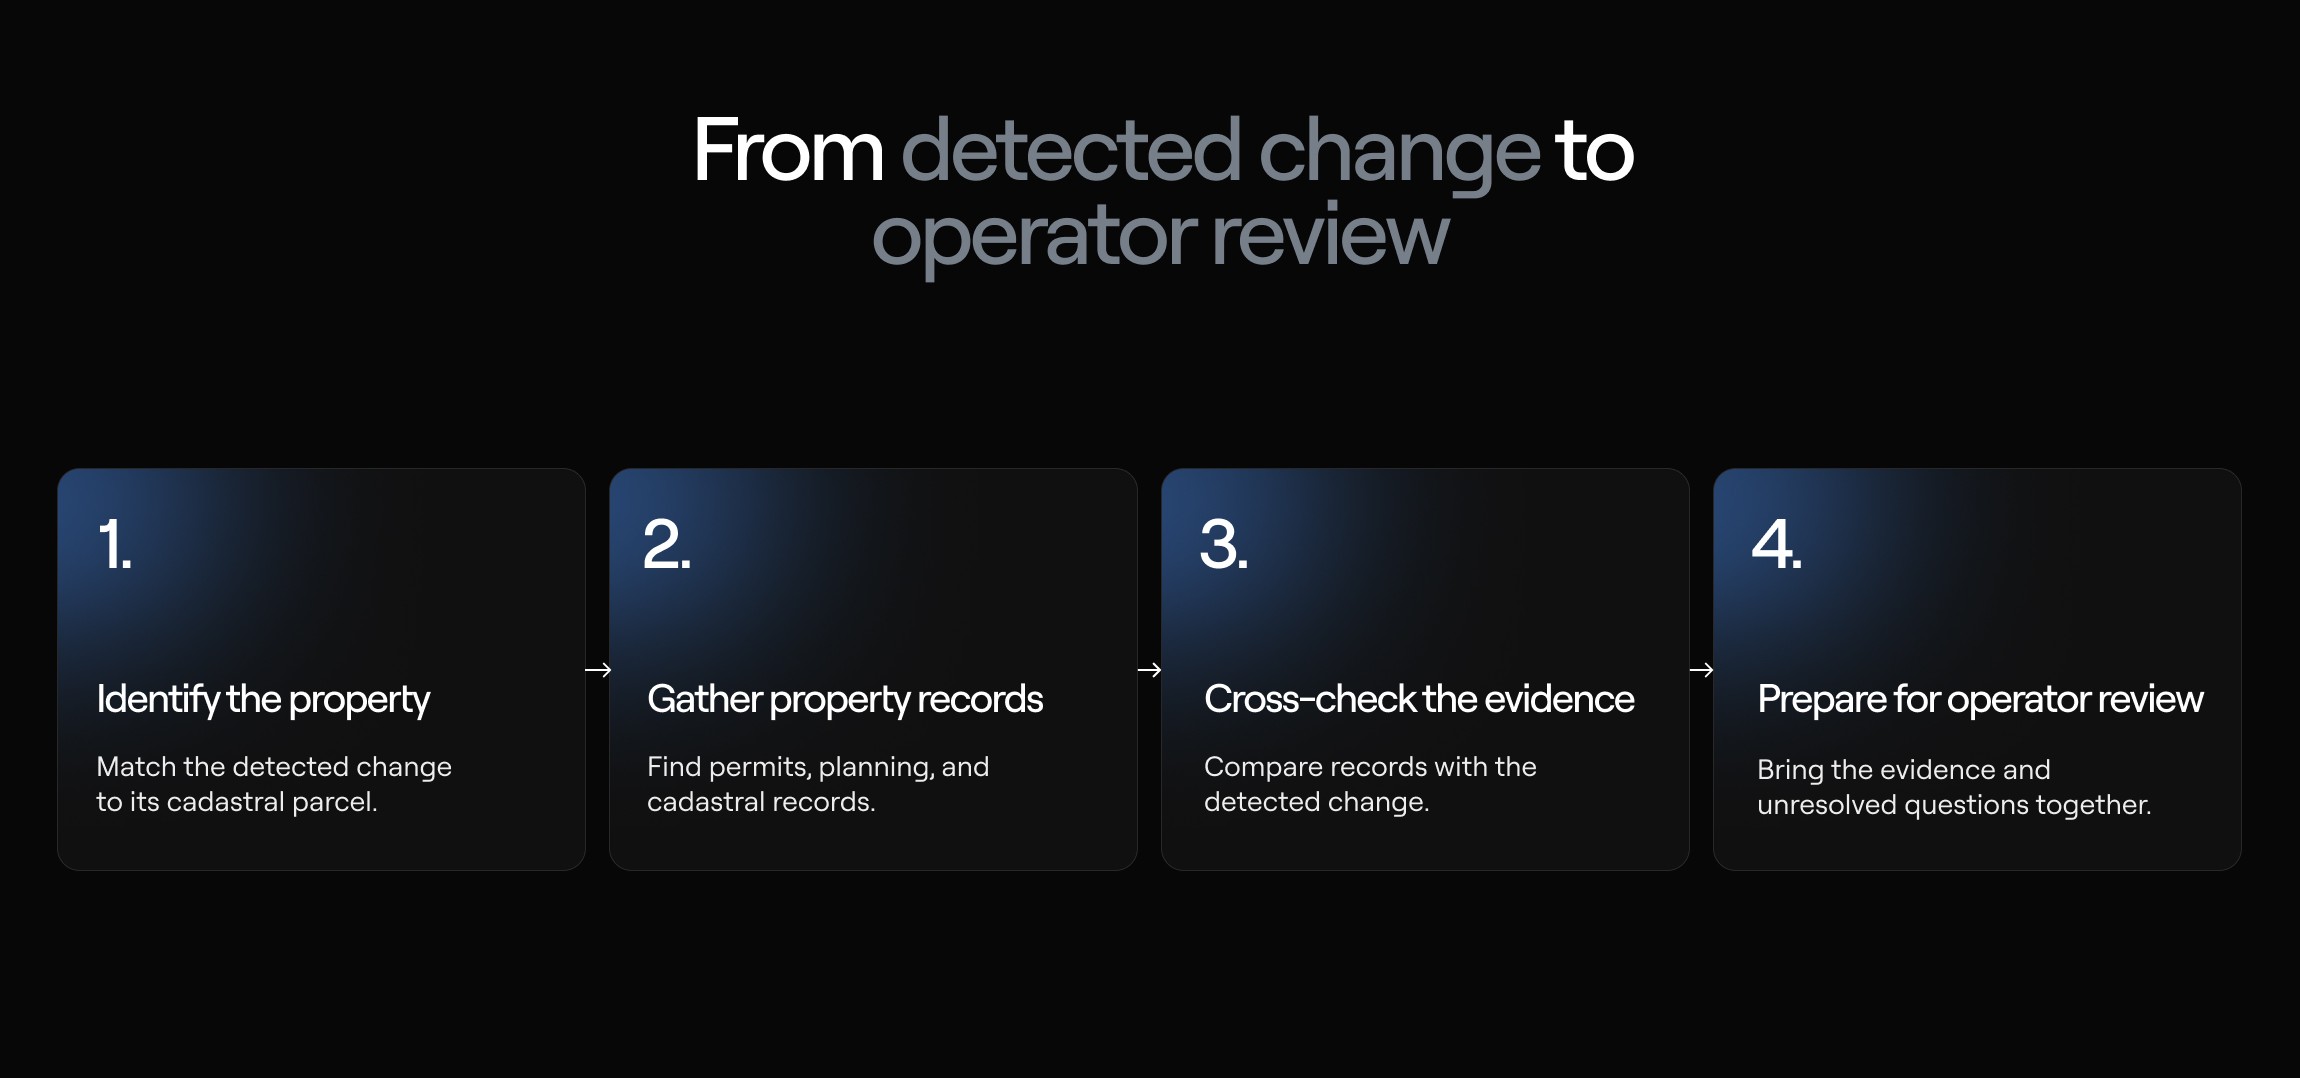
A detected change already gives us one important piece of information: its coordinates.
From there, we can work outward from that location to figure out which property the change belongs to and what is happening there.
Here’s how that would work.
1. Connect the change to the right property
Say the monitoring system picks up a new structure near the pipeline. We already know where the change happened, so the next question is which property it belongs to.
Using those coordinates, the AI can identify the corresponding cadastral parcel, take the parcel number or another available property identifier, and use it to find records tied to that specific property.
2. Find out what is happening on that property
Now the agent has something specific to follow. If a building permit comes up, for example, it can read what was approved, when it was approved, and what type of development the permit covers.
A planning application might tell us more about how the property will be used, while cadastral or land records can fill in details about the property itself.
Step 3: Check whether the records line up with what we can see
Say the imagery shows construction and the agent finds a permit for a residential development on the same parcel.
It can compare when the permit was issued with when construction first appeared in the imagery and check whether the development described in the records matches what the monitoring system picked up.
But the first record may only answer part of the question. A permit could describe a development that hasn’t been built yet.
A cadastral record could identify the property and its owner without telling us how a new structure will be used.
When something is missing or two sources don’t line up, the agent can follow the information into other available records and flag anything it still can’t confirm.
Step 4: Bring the evidence back to the operator
By then, the operator can see much more than a change highlighted in the imagery.
They can see which property it belongs to, what the available records say about the structure or activity, when the relevant permits were issued, and whether the evidence points to a temporary or more permanent change.
They can also see where the records conflict or where the agent couldn’t find enough information to reach a conclusion.
The operator’s specialists can check those points themselves and decide what the change means for the pipeline.
Review questions | Image detection and classification | With agentic AI layer |
|---|---|---|
Change | Detects and assesses spatial changes | Adds records explaining the change |
Property use | Limited by visible information | Adds registered or intended use |
Duration | Tracks change across observations | Adds evidence of expected duration |
Timing | Dates change between observations | Adds permit and planning dates |
Evidence | Primarily imagery-based evidence | Connects multiple external sources |
Review | Operator investigates flagged changes | Operator reviews assembled evidence |
How Our AI Tools Support Pipeline Class Location Monitoring
Corridor Change Detector
Automating image comparison for spotting new activity along a pipeline
The detection feature allows operators to automatically compare incoming visual data against the existing baseline of the corridor to see exactly what physically changed along the surrounding environment.
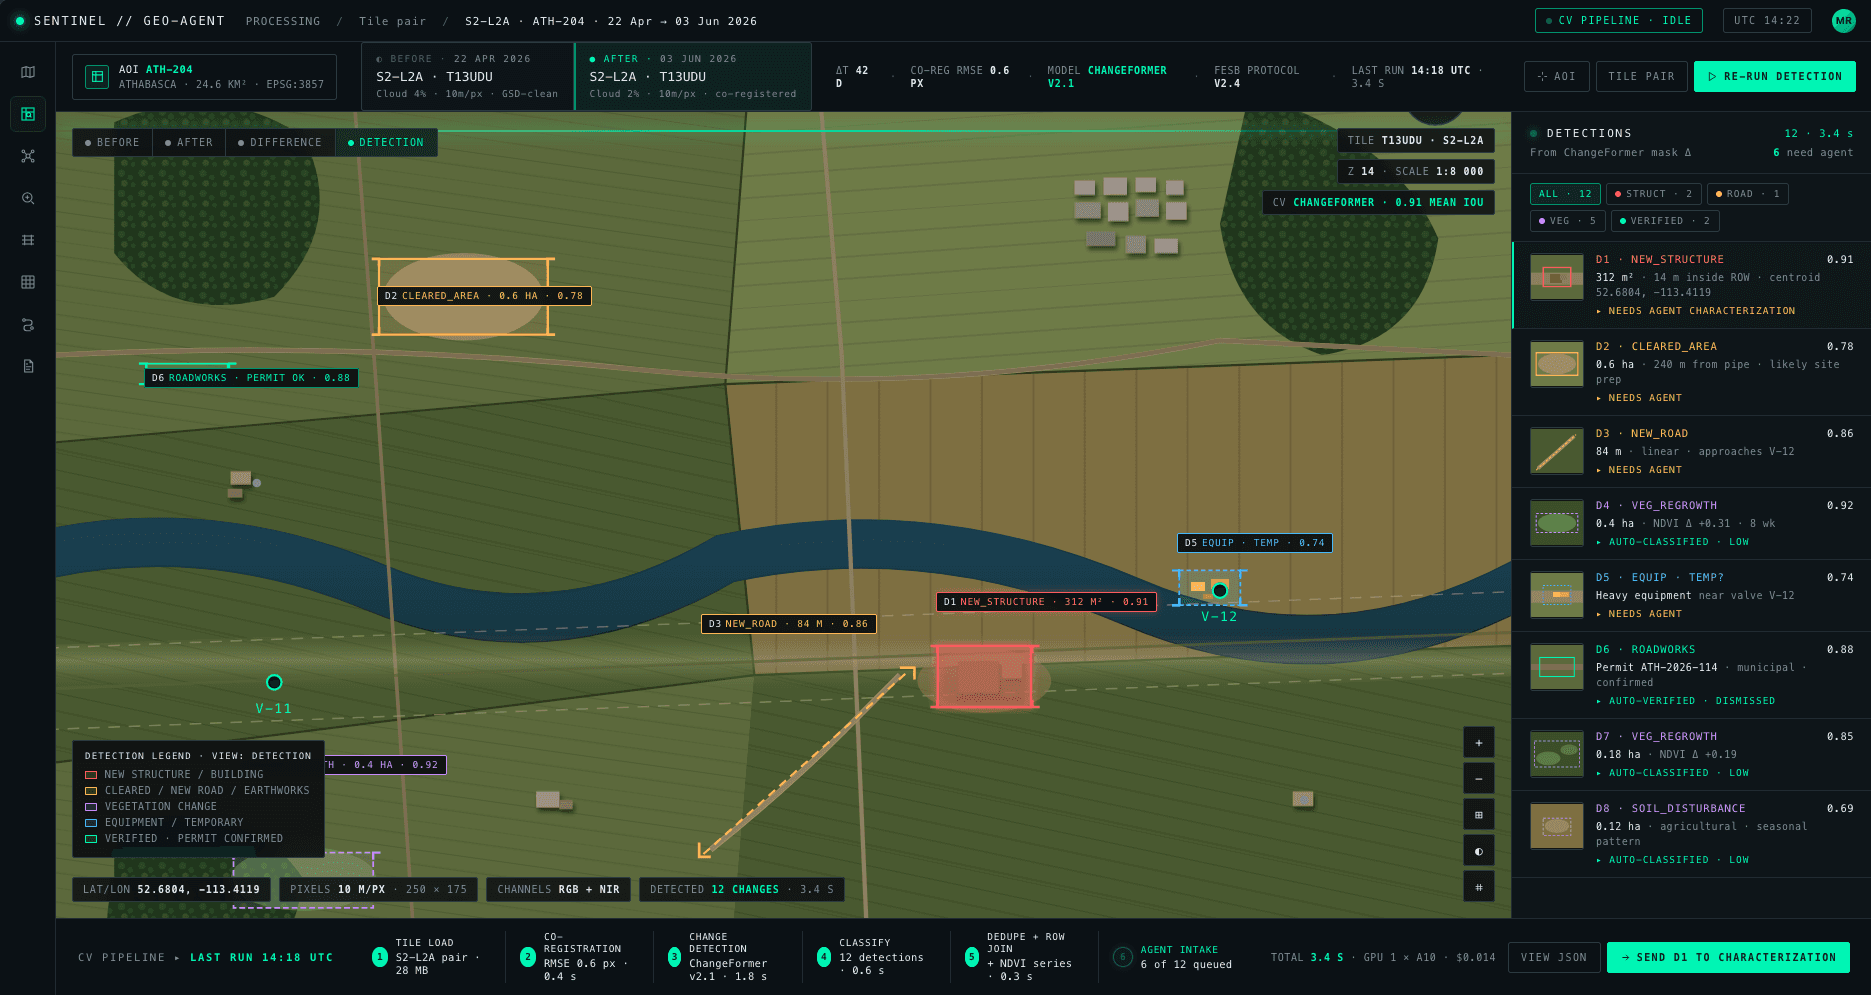
Instead of simply dropping a generic pin where pixels don't match, the system identifies and categorizes specific developments (for example: freshly cleared land, municipal roadworks, parked heavy equipment, or newly poured foundations), and logs their exact coordinates.
This converts raw imagery straight into a prioritized list of actual ground events, giving analysts clear context for every alert before they even open the map.
Class Transition Tracker
Tracking when a pipeline moves into a stricter safety class as its surroundings grow
The whole purpose of the Class Location Risk feature is to remove the necessity for manually recalculating the structure density of the area near the pipeline.
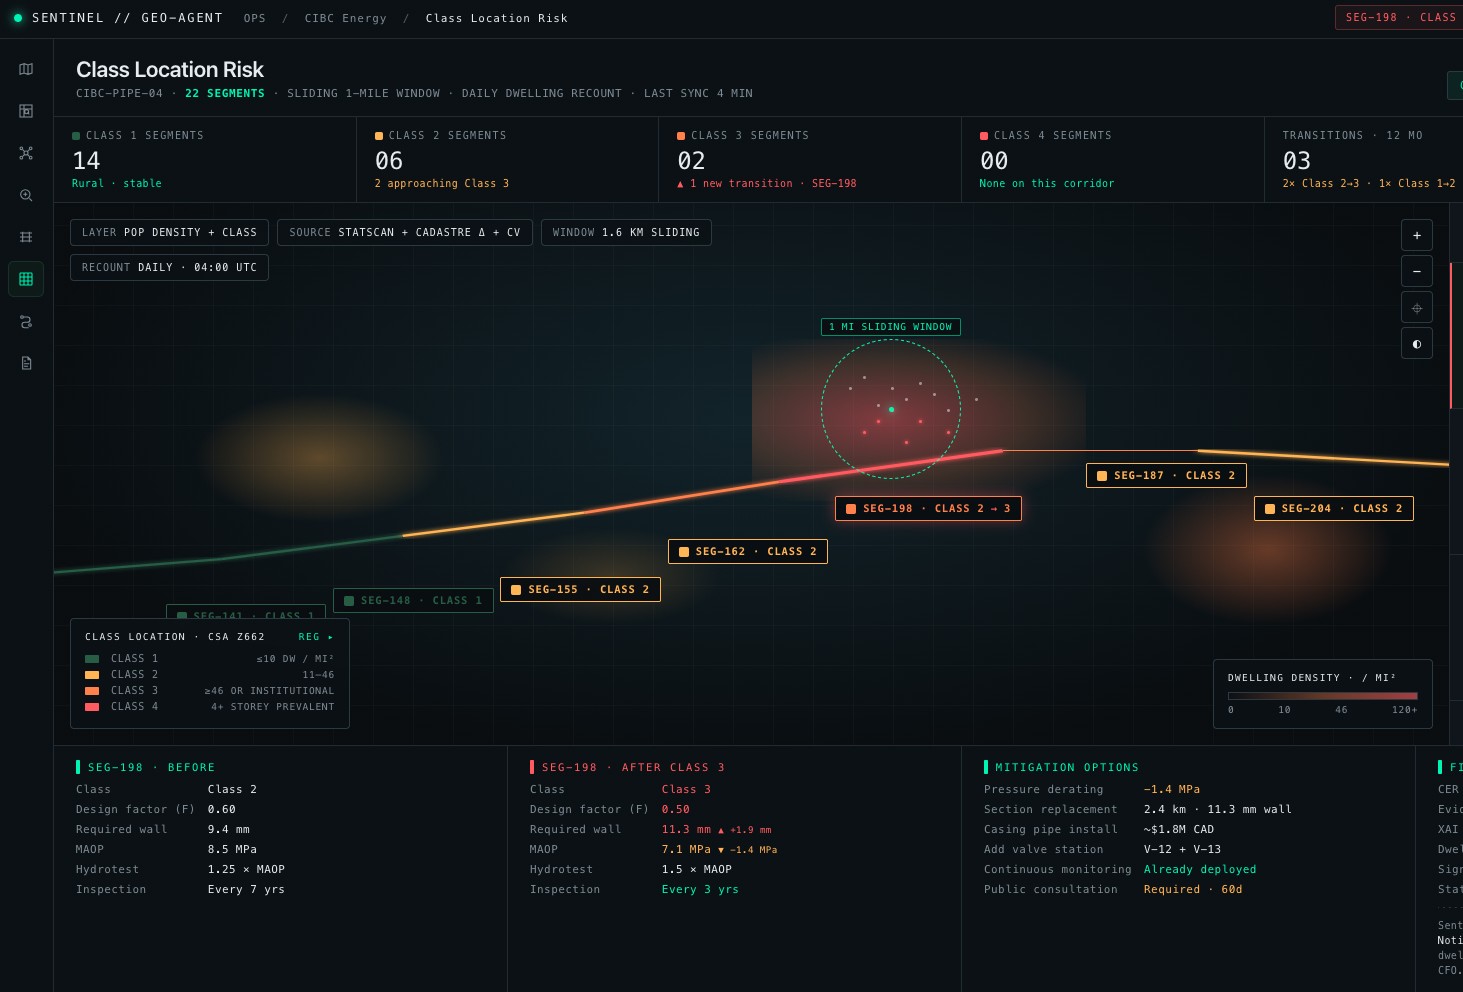
It runs a continuous "sliding mile" window across the pipeline network, and it counts the dwellings around the pipeline and tracks when a specific segment is approaching a stricter safety class.
This helps the GIS team to flag active transitions and immediately outline the required mitigation options (for example: a rural stretch upgrading from Class 1 to Class 2 because of surrounding growth).
Regulatory Report Generator
Turning the system's findings into a finished compliance report
The Report Builder takes the system’s spatial detections and safety calculations and formats them directly into a regulatory filing.
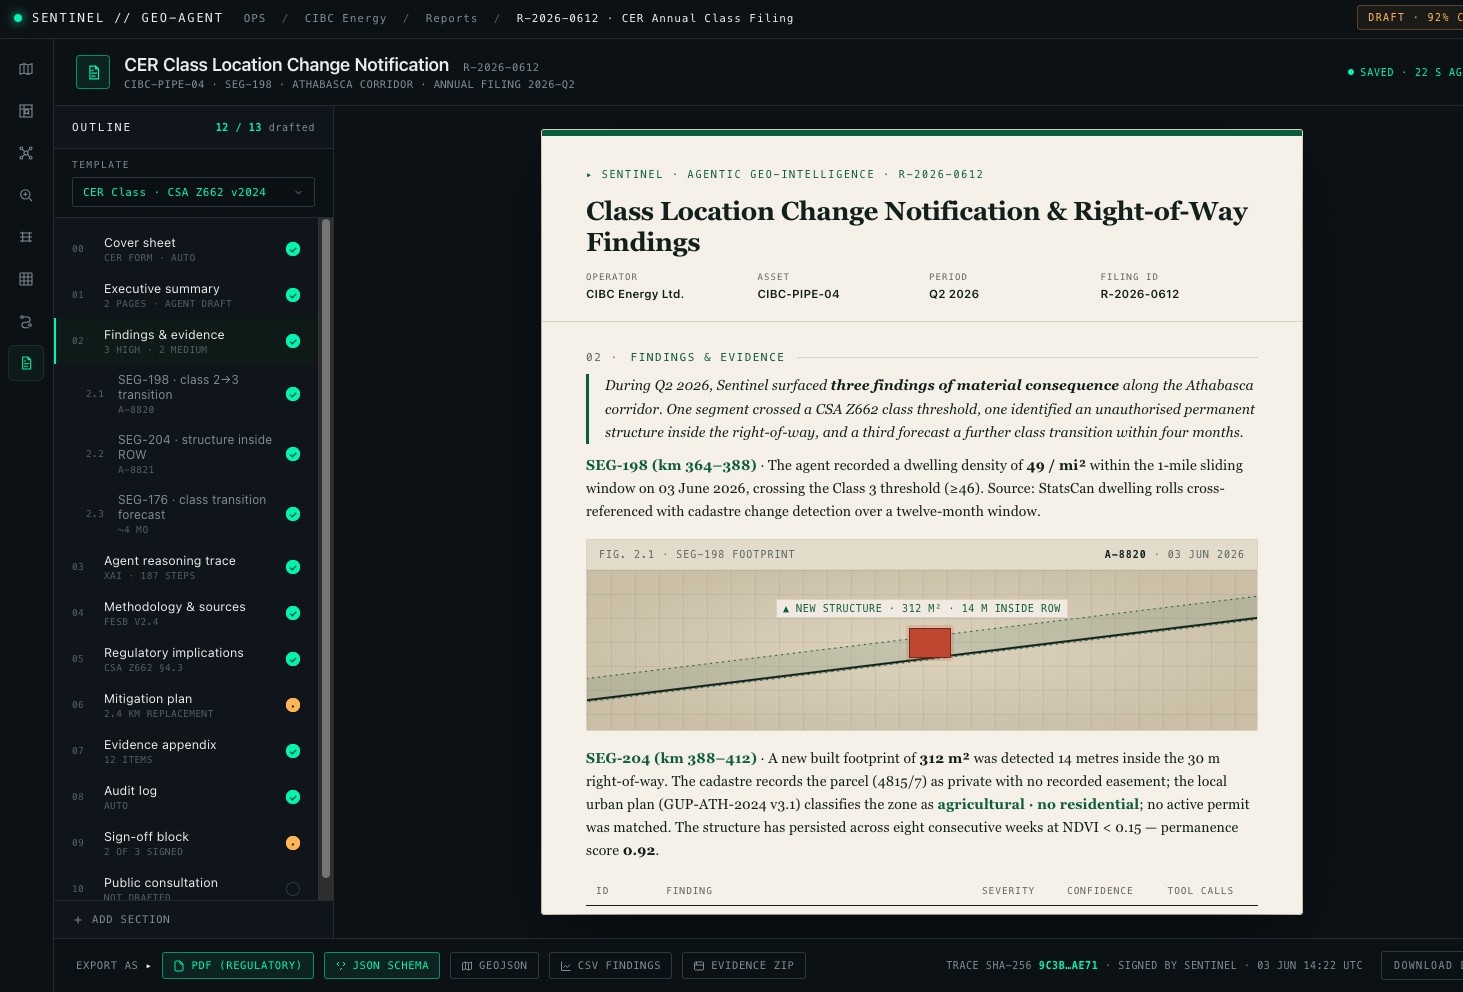
Instead of compliance teams manually compiling map screenshots, cadastre lookups, and regulatory codes into a word processor the platform automatically structures the gathered evidence into a standard template.
It drafts the required narratives for class transitions or right-of-way encroachments and attaches the exact audit trails, methodology citations, and visual masks required for a regulator's final sign-off.
Full-Route Boundary Tracker
The ROW Encroachment Monitor gives an operator a bird's-eye view of an entire pipeline route to track where physical objects are getting too close to the pipe.
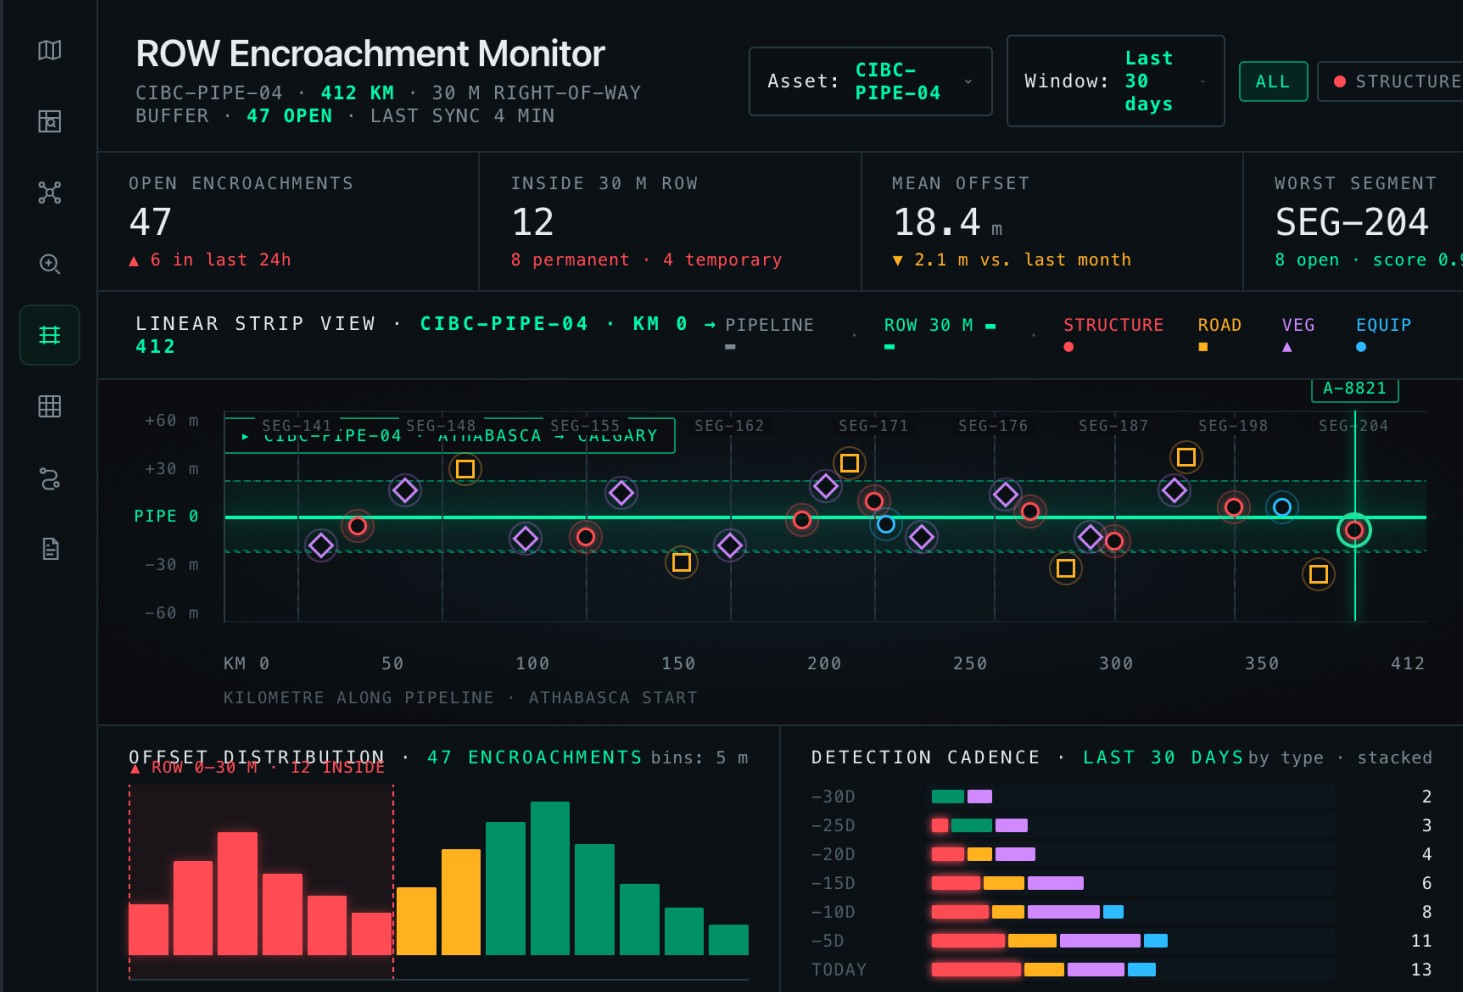
It takes a long pipeline route and flattens it into a straight visual timeline, plotting every detected issue—such as a building, a road, or heavy equipment—based on how many meters away it is from the center line.
It counts how many of those objects have crossed the legal boundary and ranks the different sections of the pipeline by risk, so the operator knows exactly which geographic areas have the most violations to deal with.
FAQ
How does the AI handle different data sources across jurisdictions?
There isn’t one permit, cadastral, or planning database that works the same way everywhere.
The available sources, formats, terminology, and access rules change by jurisdiction. The AI layer therefore needs to work with the sources available for a particular location and make it clear when information isn’t accessible or doesn’t exist.
Can AI eliminate false positives from change detection?
No change-detection model catches everything perfectly, and adding an AI layer doesn’t make that problem disappear.
What the additional layer can do is check a detection against other evidence before a specialist spends time on it. If imagery flags activity and the available records explain it, the operator receives that evidence with the detection. If the evidence remains inconclusive, the case stays unresolved for review.
Does the AI determine the class location?
The operator still owns that decision.
The AI layer can find records, connect them to a detected change, compare evidence, and surface information relevant to the assessment. The operator’s specialists review that evidence and determine how it affects the class location and whether further action is required.
What happens when the AI can’t find enough information about a detected change?
It doesn’t need to force an answer. If the available records don’t establish what a structure is used for, whether it is temporary, or another detail the operator needs, the case can reach the specialist with that information still marked as unresolved.
The operator can see what the AI found, what it couldn’t confirm, and where human review is still needed.
Exploring AI for pipeline integrity or class location monitoring? Talk to Profico about a focused pilot using your monitoring workflow, geographic coverage and available data sources.